

By Emelie Douglas, LPC, MBA · Founder, Sprout Your Practice
There are eight numbers we look at every month, and they take about ninety minutes to review. Not thirty metrics on a dashboard — eight, each with a range I expect and a specific point where I stop and do something about it.
Most KPI lists for therapy practices are either software marketing or borrowed from medical clinics, where the economics are different enough to make the advice actively misleading. This is the actual list we use at Sprout Therapy PDX, for our team of 40 clinicians. The definitions and the logic transfer to a practice of five. The thresholds are mine, and you should expect yours to differ.
Why are most KPI lists useless for therapy practices?
Because they measure charges rather than collections, and because they assume a clinic model where the provider is fungible and the appointment is short. In outpatient therapy the appointment is the unit of production, the clinician relationship is the product, and the gap between what you bill and what you collect can be enormous.
That produces one rule that governs everything below: track attended sessions and collected dollars. Scheduled sessions and billed charges will both flatter you, and neither pays anyone.
What are the eight numbers?
For each: what it is, where to pull it, the range I expect, and what makes me act.
1. Completed sessions per week (practice-wide)
The volume of care actually delivered. Pull from your EHR, filtering to attended appointments only. This is the top-line unit — revenue is downstream of it. I watch the trend, not the absolute number, and I compare against the same week last year rather than last week, because seasonality in therapy is real and predictable. Trigger: three consecutive weeks below the prior-year comparable, absent a known holiday.
2. Clinician utilization
Attended sessions divided by the sessions that clinician is contracted and available to hold. This is the number that tells you who is underfull, which practice-wide volume hides completely. A practice can look healthy in aggregate while two clinicians sit at half capacity and quietly start looking for other work.
Trigger: any clinician two months below their target, or anyone consistently well above it — sustained over-full is a burnout signal, not a win.
3. No-show and cancellation rate
Attended sessions as a share of scheduled ones, tracked practice-wide and by clinician. Reported rates in outpatient mental health commonly land in the 20–30% range, and research shows attendance at initial appointments runs worse than at established ones — so track new-client and established-client rates separately or you will misread the problem.
Trigger: a sustained rise, or one clinician well above the practice average, which is usually a scheduling or engagement issue rather than a client-population issue.
4. Collected revenue per attended session
Total collections in the month divided by attended sessions in the month. This single number catches payer mix erosion, rate changes, denial creep, and collection failures — all of which are invisible if you only watch your fee schedule. It is the most useful number on this list and the one practices are least likely to compute.
Trigger: any month-over-month decline of more than a few percent that you cannot immediately explain.
5. Aged accounts receivable
The share of your AR that is 60-90 days old and more than 90 days old. Pull from your billing system. Old AR (90 days or more) is mostly uncollectable and always a symptom — of a credentialing gap, an eligibility process that is not catching problems, or claims not being worked. AR that is 60-90 days old may still be collectable, but you need to move fast!
Trigger: the over-90 share climbing two months in a row. I would rather find this at month two than at year end.
6. Clinical labor as a percentage of net revenue
Total clinician compensation — wages, taxes, benefits, and any stipends — divided by net collected revenue. This is your largest cost and the number that determines whether the model works at all. It is also where a well-intentioned pay structure quietly makes the practice unsustainable.
Trigger: drifting up two consecutive quarters. Because pay changes are hard to reverse, this is one to catch as a trend rather than as a crisis.
7. New inquiries and inquiry-to-intake client conversion
Count of qualified inquiries, and the share that become ongoing clients. Pull from wherever you log screeners or initial contact — and if that is nowhere, that is this month's project. This is the only leading indicator on the list; everything else tells you what already happened. A conversion rate falling while inquiries hold steady means a bottleneck in your intake process, not a marketing problem.
Trigger: either number down two months running.
8. Rolling 12-month clinician retention
Clinicians who stayed, as a share of those employed twelve months ago. I review this quarterly, not monthly, because a monthly reading of an annual figure is noise. We run around 90% annually, and that number is the reason most of the others stay stable — a departure costs a vacancy, a hiring cycle, a credentialing cycle, and a caseload rebuild.
Trigger: any decline, plus a real exit conversation every single time, whether or not the number moved.
A note on the ranges: I have given directional thresholds rather than our exact internal targets, because your payer mix, fee structure, and stage will move all of them. Set your own by measuring your practice for three months and using your own baseline as the benchmark.

Which numbers can you ignore in your first year?
Three, and ignoring them will make you calmer without making you less informed.
Website traffic and social media followers. These are not business metrics at small volume. Inquiries are the metric; traffic is one input to it. If inquiries are healthy, traffic is doing its job at whatever number it is.
Benchmarks from other practices. Your first-year numbers are dominated by one-time events — one credentialing delay, one clinician's leave, one payer's slow month. Comparing that to someone else's mature practice tells you nothing useful. Compare yourself to your own prior quarter.
Billed or charged revenue. In any practice with insurance, gross charges are close to fiction. They bear no reliable relationship to what arrives in your account. Track collections. If your billing reports lead with charges, change the report.
How often should you actually look?
Split the eight by cadence, and the review stops feeling like a second job.
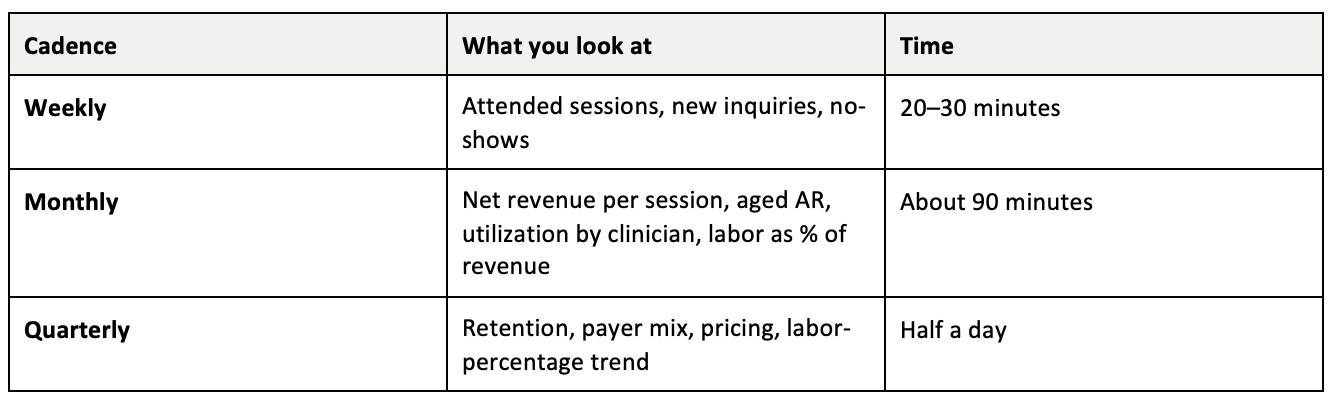
The weekly review is a scan for anything moving fast. The monthly review is where decisions get made. The quarterly review is where you change structural things — pay, panels, rates — that should not be touched on a monthly impulse.
One more thing about triggers: a trigger means investigate, not react. When utilization drops for one clinician, the answer might be a pipeline problem, a scheduling problem, a health issue, or a client population that churns faster than average — and the right response differs completely across those. The number tells you where to look. It does not tell you what you are looking at. I have made expensive decisions by skipping that step and treating a metric as a diagnosis.
One discipline worth more than any metric: write down what you expected to see before you open the report. If you are surprised often, your mental model of the practice is out of date, and that is more important information than any single number.
What do you do with this?
Pick three of the eight and track them for one quarter. My recommendation for a practice under ten clinicians: attended sessions, net collected revenue per attended session, and utilization by clinician. Those three catch most problems early. Add the rest as the habit holds.
If you want the templates and dashboard structure I use for this, that is what Practice Builder is. If you want help reading your own numbers and deciding what they mean, book a free consultation.
FAQ
What's the single most important number for a group practice?
Collected revenue per attended session. It compresses your rates, payer mix, denial rate, and collections performance into one figure, and it is the number most likely to be quietly declining while a practice feels busy. Growing session volume at a falling net rate per session is how practices get bigger and less profitable at the same time.
How do I track these without expensive software?
A spreadsheet is genuinely fine, and for practices under about ten clinicians it is often better, because you are forced to know where each number came from. Pull attended sessions and inquiries from your EHR, collections and AR from your billing system, and payroll from your bookkeeping. Consider dedicated dashboard software when the pulling itself becomes the bottleneck — not before.
About the author
Emelie Douglas is a Licensed Professional Counselor, MBA, and the founder of Sprout Your Practice. She built Sprout Therapy PDX from a solo private practice into a group of 40+ clinicians with ~90% annual retention, and served as president of the Oregon Counseling Association. She helps therapists and group practice owners grow businesses that are profitable, ethical, and sustainable — without burnout. Book a free consultation.